


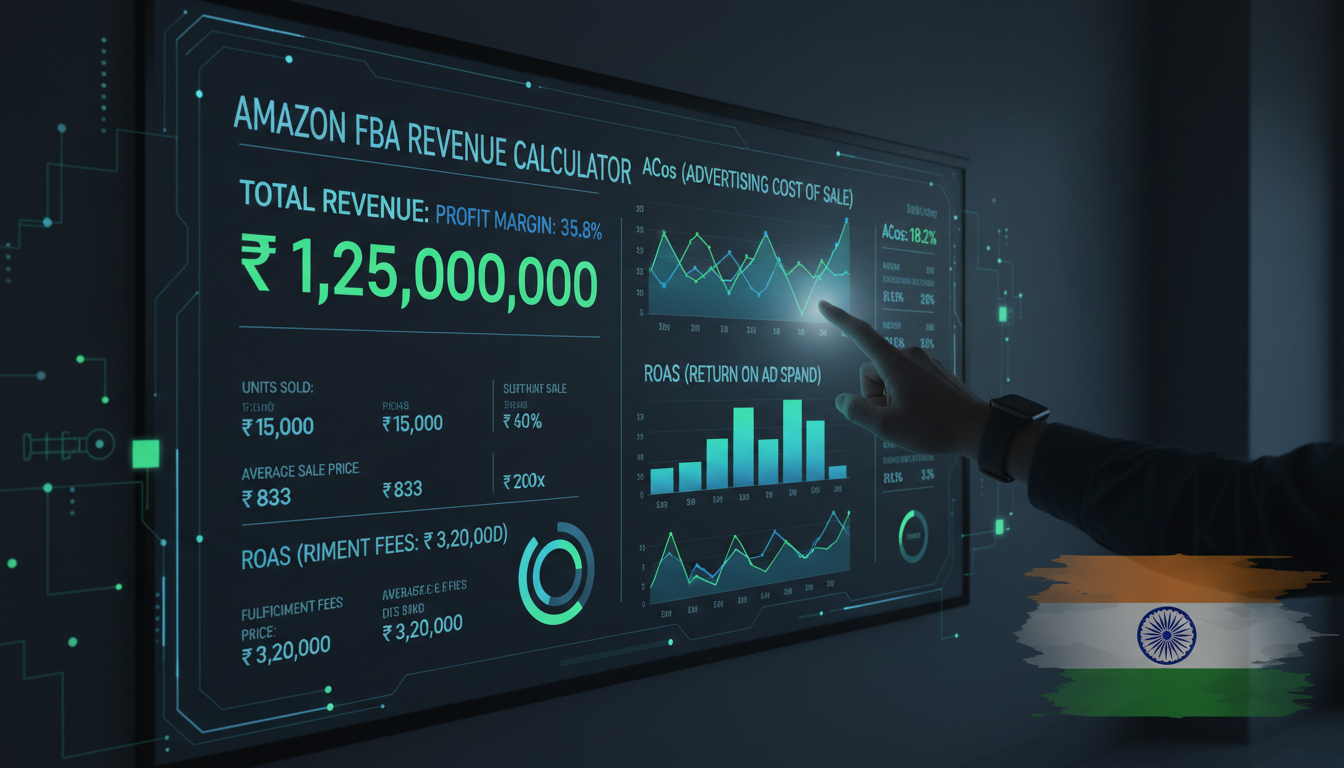
Here is the brutal truth: 47% of Amazon sellers admit that fee calculations are their single biggest challenge — yet most are still relying on guesswork.
If you have ever launched a product on Amazon, watched your sales volume climb, and still ended the month with razor-thin margins, you already understand the pain. The Amazon FBA calculator is one of the most essential — and most underused — tools available to sellers. Used correctly, it is not just a cost estimator; it is a profit engineering weapon.
Whether you are a D2C brand scaling on Amazon India, an FMCG company exploring FBA, or an agency managing multiple ASINs, this step-by-step guide will show you exactly how to extract maximum revenue intelligence from the Amazon FBA estimator — and then layer AI-powered ad optimization on top to compound those gains.
Stop bleeding ad spend on non-converting keywords.
Let AdAstraa's AI optimize every ASIN for true profitability — automatically.
Start Your Free Trial Today →
What Is the Amazon FBA Calculator (And Why It Is More Powerful Than You Think)
The Amazon FBA Revenue Calculator — often searched as the Amazon revenue calculator or amazonfbacalculator — is a free tool provided by Amazon that lets sellers estimate their net profit after all FBA-associated costs are deducted from a product's sale price.
It is accessible directly through Amazon Seller Central or via Amazon's public-facing calculator page. At its core, it answers one essential question: "If I sell this product at this price, how much money will I actually keep?"
For brands investing in Amazon advertising, this matters enormously. Your ad spend only makes sense when you know your true margin floor. Without that number, every campaign bid is a shot in the dark.
FBA vs. FBM: Choosing the Right Model
The Amazon FBA estimator also allows you to compare Fulfillment by Amazon (FBA) against Fulfillment by Merchant (FBM). FBA handles storage, packing, and shipping in exchange for fulfillment fees. FBM puts those logistics in your hands — potentially reducing Amazon fees but adding your own overhead.
For most sellers focused on scaling with Amazon PPC campaigns, FBA wins on conversion rate (Prime badge, faster shipping) but requires rigorous cost modeling to stay profitable.
“Amazon's advertising revenue crossed $56 billion in 2024 — a 20% year-over-year increase. More ad dollars in the ecosystem means fiercer competition and higher CPCs. Your margin math has never mattered more.”
The Essential Fee Breakdown Every Amazon Revenue Calculator User Must Know
Before you can trust the output of any Amazon FBA estimator, you need to understand what goes into it. Many sellers plug in a selling price and product cost, glance at the net profit number, and move on — this is a critical mistake.
Here is a full breakdown of the fee layers you must account for:
1. Referral Fees
Amazon charges a referral fee on every sale — typically between 5% and 45% depending on the product category. Electronics on Amazon India, for example, may carry a different referral rate than home goods. Always verify your category rate before modeling profitability.
Formula: Referral Fee = Selling Price × Referral Fee Percentage
2. FBA Fulfillment Fees
Fulfillment fees are charged per unit and based on the product's size tier and weight. For standard-sized items, these typically range from $2.50 to $10+ per unit in the US market. On Amazon India, these are calculated in INR with local/regional/national shipping zones applied.
Sellers who ignore size tier classification often end up in a higher-cost bracket than necessary — a silent profit killer.
3. Monthly and Long-Term Storage Fees
Products sitting in Amazon's warehouse beyond 365 days attract long-term storage fees. Even monthly storage fees add up significantly for slow-moving SKUs. The Amazon FBA calculator lets you estimate monthly storage, but you must input your product's cubic footage accurately.
4. Closing Fees (India-Specific)
For sellers on Amazon India, closing fees apply to products in specific categories (like electronics, books, and media). These are fixed per-unit charges and must be added to your Amazon FBA calculator India inputs for an accurate picture.
5. Hidden & Often-Forgotten Costs
- Returns processing fees — applicable in categories like apparel
- Inbound placement fees — new in 2024, for directing inventory to specific fulfillment centers
- PPC ad spend per unit — advertising is no longer optional; model 15–30% of selling price
- GST (India) — 18% GST on Amazon's service fees must be factored into your cost base
- Removal and disposal fees — if a product needs to be pulled from inventory
| Fee Type | Typical Range | Profit Impact |
|---|---|---|
| Referral Fee | 5% – 45% | High |
| FBA Fulfillment Fee | $2.50 – $10+ per unit | High |
| Monthly Storage Fee | Variable (cubic ft) | Medium |
| Returns Processing | Category-specific | Medium |
| PPC Ad Spend (per unit) | 15% – 30% of price | Very High |
7 Proven Steps to Use the Amazon FBA Calculator for Maximum Revenue
Using the Amazon revenue calculator is not just about plugging in numbers. It is about building a systematic profitability framework for every product you sell or plan to sell. Here is the step-by-step process used by high-performing Amazon brands.
Step 1 — Source the Correct ASIN or Product Dimensions
Start by finding the exact ASIN of a product similar to yours, or input accurate dimensions and weight. Amazon's fulfillment fees are size-tier dependent — a mistake here cascades through every downstream calculation. Use the FBA fee schedule to verify your size classification before modeling.
Step 2 — Input a Competitive, Market-Validated Selling Price
Do not guess your price. Research the top 10 competitors in your category using the online Amazon search. Your selling price must be competitive enough to generate sales velocity, yet high enough to maintain margin. Use the revenue Amazon calculator to test multiple price points.
Step 3 — Enter Your Full Landed Cost
Landed cost = Unit cost + packaging + prep + inbound freight + duties and tariffs + inspections. This is where most sellers undercount. If you paid $2,000 for tooling on a 1,000-unit run, that is $2.00 per unit of fixed cost to amortize. Include every rupee or dollar that gets the product to Amazon's warehouse.
Step 4 — Model Your Ad Spend per Unit
This is the breakthrough step most sellers skip. The default Amazon FBA estimator does not include PPC advertising costs. Add an estimated ad spend per unit sold based on your target ACoS. For example, if your selling price is ₹1,500 and you target a 20% ACoS, model ₹300 per unit in ad costs before declaring a product profitable.
Track this live with AdAstraa's Shopper OS, which provides real-time buyer intent intelligence to refine your actual ad spend per ASIN.
Step 5 — Calculate Your Break-Even ACoS
Break-Even ACoS = (Net Profit Margin Before Ads) / Selling Price × 100. If your net margin before ads is 35%, your break-even ACoS is 35%. Any campaign running above that is destroying profit. This number is your most powerful advertising guardrail.
Step 6 — Stress-Test with Return Rate Scenarios
Factor in category-specific return rates. For electronics on Amazon, return rates of 10–15% are common. At ₹2,000 selling price and a 10% return rate, you are losing ₹200 per 10 units sold in pure revenue — before processing fees. The Amazon FBA calculator does not auto-include this. Build a separate returns column in your model.
Step 7 — Compare FBA vs. FBM and Set Minimum Viable Price
Use the side-by-side comparison feature in the Amazon revenue calculator to evaluate FBA against your own fulfillment costs. Then identify your Minimum Viable Price — the lowest price at which you still earn your target net margin (typically 20–30% for sustainable Amazon growth). Anything below this is a loss-leader territory that only works with a deliberate strategy.
Real-World Example: How an Electronics Brand in India Recovered ₹4.2L in Monthly Ad Waste
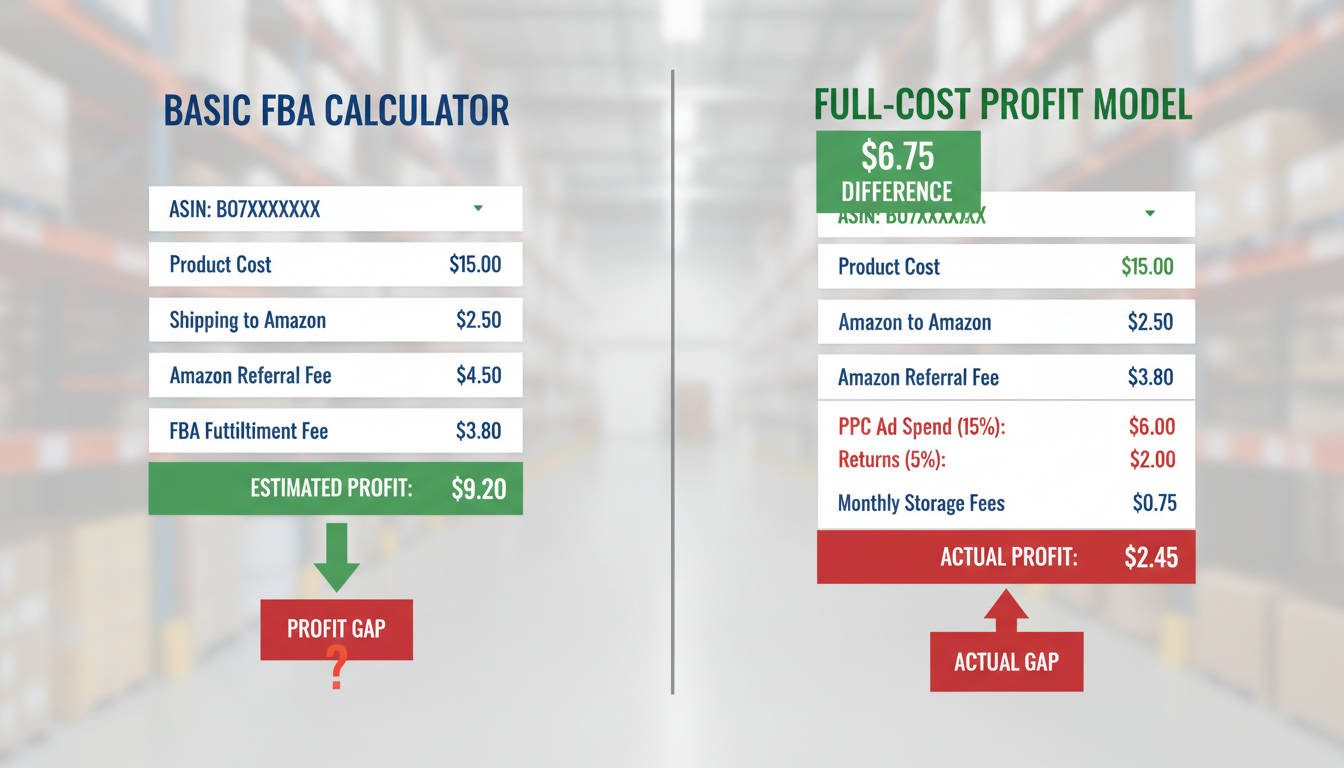
Consider a mid-sized electronics brand selling on Amazon India — let's call them TechNest. They were generating ₹18 lakh per month in revenue with what appeared to be a healthy 22% gross margin per the Amazon FBA estimator.
But when they rebuilt their cost model using the full seven-step framework above — including PPC ad spend (running at 31% ACoS against a 22% break-even), return rate provisions (14% for electronics), and closing fees — their actual net margin was negative 4%.
They were growing their way to bankruptcy.
After integrating AdAstraa's Autopilot bid optimization and eliminating non-converting keywords identified by Shopper OS, TechNest brought their ACoS from 31% down to 18% within 60 days. Combined with renegotiated supplier costs and smarter inventory placement, their net margin recovered to a genuine 19% — recovering over ₹4.2 lakh per month in previously wasted spend.
“We thought we were profitable because revenue was growing. The full-cost Amazon FBA model showed us the truth — and AdAstraa gave us the tools to fix it fast.”
— Category Manager, Electronics Brand, Amazon India
Ready to uncover your true profit per ASIN?
AdAstraa's AI gives you real-time True Profit visibility across every SKU — no spreadsheets required.
See Your True Profit Now →Advertising in India + FBA: Why the Revenue Calculator Is Your Most Powerful Ad Planning Tool
India's e-commerce market is experiencing explosive, game-changing growth. With hundreds of millions of online shoppers and Amazon deeply embedded in the purchase journeys of consumers across every tier-1 and tier-2 city, advertising in India via Amazon has never had greater upside — or greater risk of wasted spend.
Amazon's global advertising revenue reached $56.2 billion in 2024 — a 20% year-over-year increase. The Indian marketplace is one of its fastest-growing verticals. That means more competition, rising CPCs, and a more unforgiving margin environment for underprepared sellers.
Here is the essential connection most sellers miss: your Amazon FBA calculator output should directly inform your ad budget. Specifically:
- Use your break-even ACoS as a bidding ceiling — never let automated or manual campaigns exceed it without a deliberate justification
- Model ad spend as a per-unit cost — divide total monthly ad spend by units sold to get your real cost per conversion, then plug it back into the revenue calculator
- Segment by ASIN profitability — high-margin products deserve aggressive ad investment; low-margin SKUs need tightly capped bids
- Account for GST on ad spend — in India, 18% GST is charged on Amazon advertising services, effectively increasing your real CPC by 18%
This is where AI-powered advertising strategies deliver an unfair advantage. Platforms like AdAstraa continuously recalculate per-ASIN profitability and adjust bids in real time — something no manual bidding workflow can match at scale.
What Is a Healthy Target Margin After All Costs?
Industry benchmarks suggest targeting a 20–30% net margin after all fees and ad spend for sustainable Amazon growth. During launch phases, a lower margin (15–20%) is acceptable while building rank and reviews. Mature, well-ranked products should aim for 25%+.
Anything below 15% net margin on Amazon India leaves you dangerously exposed to fee increases, competitive price drops, or ad cost spikes — all of which are inevitable in a growing, competitive marketplace.
Advanced Tips: Going Beyond the Amazon FBA Estimator
The native Amazon FBA calculator is a starting point, not a complete solution. Serious sellers and agencies layer additional intelligence on top. Here is what the best brands do differently:
Track True Profit Per ASIN — Not Just Account-Level Revenue
Many sellers track total revenue and total ad spend. The powerful move is tracking true profit per ASIN — net revenue minus all fees, costs, and ad spend allocated to that specific product. This reveals which SKUs are genuinely profitable and which are cross-subsidizing losses.
AdAstraa's platform provides real-time True Profit per ASIN visibility, eliminating the need for manual spreadsheet reconciliation across dozens of products.
Build Seasonal Fee Adjustments Into Your Model
Amazon charges Q4 peak-season storage surcharges (October–December). If you sell electronics, gifts, or seasonal products on Amazon India during Diwali or year-end sale periods, your storage fees will increase. Model this in advance by running separate calculator scenarios for peak vs. off-peak periods.
Use Your Margin Model to Build a Negative Keyword Strategy
Once you know your break-even ACoS per ASIN, you can identify which keywords are costing more than they should. Keywords generating clicks but no conversions need to be added as negatives immediately. This is one of the fastest ways to improve your net margin without changing pricing or supplier costs.
With Shopper OS, buyer intent data surfaces which keywords are genuinely converting versus which are inflating your spend — so your FBA calculator model becomes more accurate over time.
Connect Inventory Forecasting to Your Revenue Calculator Output
Overstocking increases long-term storage fee risk. Understocking causes stockouts that destroy organic rank and force higher CPCs to recover lost velocity. Feed your FBA calculator's unit economics into your inventory forecasting model so that your stock levels are always sized to your true margin — not just your revenue targets.
Using the Amazon FBA Calculator for India-Specific Sellers: What Is Different
While the core logic of the Amazon FBA estimator is universal, India-based sellers face a distinct set of variables that require specific attention:
- GST on Fees: All Amazon India service fees — including FBA fulfillment fees, referral fees, and advertising — attract 18% GST. This is a significant cost that the standard international FBA calculator does not account for.
- Shipping Zones: Amazon India categorizes shipping as Local, Regional, or National. The farther your inventory ships from the fulfillment center to the customer, the higher the per-unit shipping fee.
- Closing Fees: Fixed closing fees apply to many product categories on Amazon.in — including electronics, books, and media — unlike the global FBA model.
- Weight Handling Charges: India uses a weight handling fee structure separate from the US/UK dead weight + dimensional weight calculation. Ensure you use the India-specific fee schedule.
- Easy Ship vs. FBA: Amazon India's Easy Ship option (where Amazon picks up from your location) has its own fee structure and should be modeled separately if you are considering it as an FBM alternative.
For the most accurate India-specific calculations, use the Amazon Seller Central Revenue Calculator within your .in Seller Central account, which automatically applies the correct GST and India fee schedules to your inputs.
The AI Layer: Turning Your Revenue Calculator Data Into Automated Profit Growth
Running the Amazon FBA calculator once is a snapshot. Running it continuously — across every ASIN, every week, updated with real ad spend and return rate data — is an effortless operating system. That is what AI-powered platforms make possible.
AdAstraa is built specifically for this workflow. Here is how its tools connect to your FBA cost model:
- Autopilot: 24/7 bid optimization that continuously recalibrates keyword bids against your per-ASIN break-even ACoS — not a fixed account-level target.
- Shopper OS: Buyer intent intelligence that identifies which search terms are driving high-intent, high-converting traffic vs. wasting your ad budget — directly improving your per-unit ad cost model.
- EcomGPT: Automated customer operations that reduce manual response overhead, improving effective margin by recovering time costs often invisible in spreadsheet models.
- AdCreative+: AI-generated ad creatives optimized for conversion — because higher CVR means lower effective CPC and a better real-world ad spend per unit sold.
Together, these tools turn your static Amazon revenue calculator output into a living, self-optimizing profit engine. Visit the AdAstraa case studies to see documented results from brands using this exact approach.
Additional Resources
Deepen your knowledge of Amazon FBA profitability and advertising strategy with these authoritative external references:
- 📘 Amazon Seller Central: How to Estimate Profits with the FBA Revenue Calculator — The official Amazon guide to using the FBA Revenue Calculator, including step-by-step instructions and FAQs directly from Amazon.
- 📊 Jungle Scout: Amazon Statistics 2024 — Comprehensive, data-driven statistics on Amazon seller demographics, advertising growth, and marketplace trends every seller should benchmark against.
- 📈 Amazon Advertising: How to Help Increase Sales with FBA and Advertising — Amazon's official guide connecting FBA strategy with advertising best practices, including ROAS benchmarks and campaign optimization tips.
- 🔍 Adbrew: How to Use the Amazon FBA Calculator — A Step-by-Step Guide for Sellers — A detailed tactical guide covering fee formulas, margin calculations, and practical tips for integrating FBA cost modeling into your selling strategy.
- 💡 Statista: E-Commerce and Online Shopping in India — Statistics & Facts — Authoritative market size data, revenue growth projections, and segment breakdowns for India's rapidly expanding e-commerce market.
The Bottom Line: Your Amazon Revenue Calculator Is Only as Good as What You Put Into It
The Amazon FBA calculator is a proven, essential tool — but it is not a plug-and-play solution. The sellers who win on Amazon India and globally are the ones who build complete cost models: full landed costs, real ad spend per unit, seasonal fee adjustments, return rate provisions, and a clear break-even ACoS that governs every bidding decision.
Most sellers will read this and keep using a simplified version of the FBA estimator. You do not have to.
By following the seven-step framework in this guide — and layering AI optimization on top to keep your model continuously updated — you move from reactive margin management to proactive profit engineering. That is the difference between a brand that survives Amazon's fee increases and CPM spikes, and one that scales through them.
AdAstraa was built to give Amazon-first brands exactly that edge: real-time True Profit per ASIN, 24/7 bid optimization, and buyer intent intelligence working together — so your revenue calculator model is never stale, and your ad spend never outruns your margin.
Stop leaving profit on the table.
Join hundreds of Amazon-first brands using AdAstraa to lower ACoS, boost ROAS, and see their True Profit per ASIN — in real time.
Book Your Free Strategy Session →